
How Acoustic Camera Mapping for Noise Leak Detection Works
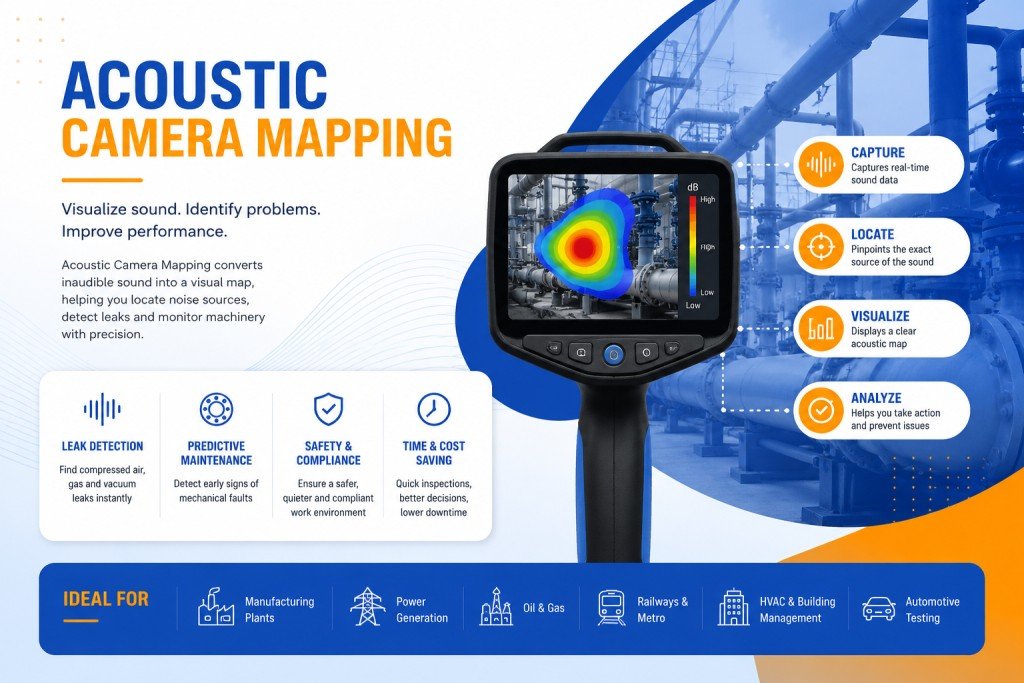
Acoustic Camera Mapping is a non-contact diagnostic technique that uses a phased microphone array combined with a synchronized high-resolution camera to create a real-time visual overlay of sound sources on a physical surface. By applying beamforming algorithms, the system calculates the direction and intensity of noise emissions and maps them as a colour-coded acoustic image over a video frame. In noise leak detection, this allows engineers to precisely locate where sound escapes from machinery enclosures, building facades, HVAC ducts, or industrial equipment without touching the surface or halting production. PackSound deploys acoustic camera technology across Indian industries to reduce noise pollution, meet compliance standards, and drive data-backed remediation.
What Is Acoustic Camera Mapping
An acoustic camera for sound source localisation works on a principle called beamforming: dozens of microphones arranged in a known geometric pattern simultaneously record sound, and the system analyses the tiny time differences (microseconds) in when sound arrives at each microphone. These delay patterns are processed by the acoustic camera working principle engine to triangulate the exact origin point of a noise source. The camera image anchors these calculations to a real-world view, producing what is called an acoustic map or noise heatmap. In India, acoustic cameras are increasingly used in automotive plants, compressor rooms, data centres, and green building certification audits where pin-pointing a noise leak is faster and more reliable than traditional sound level meter surveys.
| Specification | Typical Range / Value |
|---|---|
| Number of Microphones | 48 to 256 channels |
| Frequency Range | 200 Hz to 20 kHz (broadband models up to 80 kHz) |
| Spatial Resolution | 1 to 3 degrees angular resolution at 1 kHz |
| Measurement Distance | 0.3 m to 50 m (near-field to far-field) |
| Dynamic Range | 40 dB to 120 dB SPL |
| Output Format | Acoustic heatmap + video overlay, CSV, report PDF |
| Operating Environment | IP54 rated, suitable for industrial outdoor use |
| Benefit | What It Means for You |
|---|---|
| Non-contact measurement | No machinery shutdown required, measure during live production |
| Visual proof of noise source | Heatmap image serves as documented evidence for compliance reports |
| Multi-source discrimination | Identifies which of several leak points is dominant, not just that noise exists |
| Frequency-selective analysis | Separates tonal faults like bearing wear and gear mesh from broadband leaks |
| Rapid survey capability | A 500 sq. m. facade can be mapped in under two hours |
| Objective data for remediation | Before-and-after maps quantify the effect of treatment interventions |
| Applicable to any surface | Works on machinery, walls, ducts, vehicle bodies, and building envelopes |
| Industry / Sector | Specific Application |
|---|---|
| Automotive Manufacturing | Locating door seal leaks, gap noise, wind noise on vehicles |
| HVAC and Data Centres | Pinpointing duct leaks, fan bearing noise, casing resonance |
| Power and Energy Plants | Transformer hum mapping, generator enclosure seal audit |
| Building and Construction | Facade sound transmission weak-point identification for LEED/IGBC audits |
| Industrial Machinery OEMs | Quality control for machine noise signatures at end-of-line testing |
| Railways and Metro | Cabin noise source separation for rolling stock certification |
| Pharmaceutical / Cleanrooms | HVAC noise compliance verification without contamination risk |
| Step | Action |
|---|---|
| 1. Pre-survey planning | Define measurement distance, frequency range, and target surface geometry |
| 2. Array positioning | Mount acoustic camera on tripod or robotic pan-tilt at calculated standoff distance |
| 3. Calibration | Run internal microphone self-check and ambient noise floor baseline |
| 4. Scan acquisition | Sweep or static capture of target surface for 5 to 30 seconds per position |
| 5. Real-time beamforming | On-board or connected PC processes acoustic image live during measurement |
| 6. Frequency analysis | Filter maps by octave band to identify tonal versus broadband sources |
| 7. Report generation | Export annotated heatmap images, SPL values, and ranked source list |
| Myth | Reality |
|---|---|
| Works only in silent rooms | Designed for live industrial environments with high ambient noise |
| Only detects loud sources | Can resolve 3 dB differences between adjacent noise sources |
| Replaces all acoustics instruments | Complements, does not replace, near-field sound intensity probes |
| Too expensive for Indian SMEs | Rental and survey-as-a-service models are widely available in India |
| Only works outdoors | Equally effective indoors with appropriate beamforming algorithms |
Acoustic Camera Working Principle
The acoustic camera working principle is rooted in delay-and-sum beamforming. Consider throwing a stone into still water from the side of a pool. The ripples reach each side at different moments. Beamforming reverses this logic: if you know precisely when sound arrives at each microphone in the array, you can mathematically trace it back to its origin point in space.
The core processing pipeline runs through five stages:
- Simultaneous data capture across all microphone channels at 48 kHz or higher sampling rates
- Cross-correlation of signals to extract inter-channel time delays (on the order of microseconds)
- Beamforming computation to assign sound intensity values to a spatial grid in front of the array
- Frequency-band filtering to isolate specific tonal or broadband noise signatures
- Overlay rendering of the acoustic heatmap onto the optical camera image in real-time
Advanced systems use CLEAN-SC or functional beamforming algorithms that suppress side-lobe artefacts and give more accurate source maps in reverberant indoor environments such as machine rooms or production halls. This is particularly relevant for acoustic camera India deployments, where factory floor noise floors are often high and multiple competing sources exist simultaneously.
Also Read : Acoustic Panels in India.
Frequently Asked Questions About Acoustic Camera Mapping
No, it maps surface-radiated noise and gap leaks, not transmission through solid mass barriers.
Most compact arrays start at 200 Hz; large aperture systems can reach down to 80 Hz.
Yes, PackSound and specialised consultants offer survey-as-a-service across Indian cities.
At mid-high frequencies above 1 kHz, accuracy is comparable; at low frequencies, intensity scanning is more precise.
Yes, the machine must be in its normal operating condition to detect real noise leaks accurately.
A single machine enclosure takes 30 to 60 minutes including setup, capture, and report export.
Yes, using multiple scan positions stitched together into a panoramic acoustic image of the facade.
Acoustic cameras map audible-range sources visually; ultrasonic detectors find compressed air or gas leaks above 20 kHz.
Wind above 4 m/s significantly raises noise floor; rain causes similar degradation; windshields help for moderate conditions.
Standard outputs include heatmap images, frequency plots, and SPL tables in PDF, CSV, and video formats.